This guide covers every view and option in VpsMonitor.Pro — the same help that is built into the app. Use the contents below to jump to a section.
What is VpsMonitor.Pro
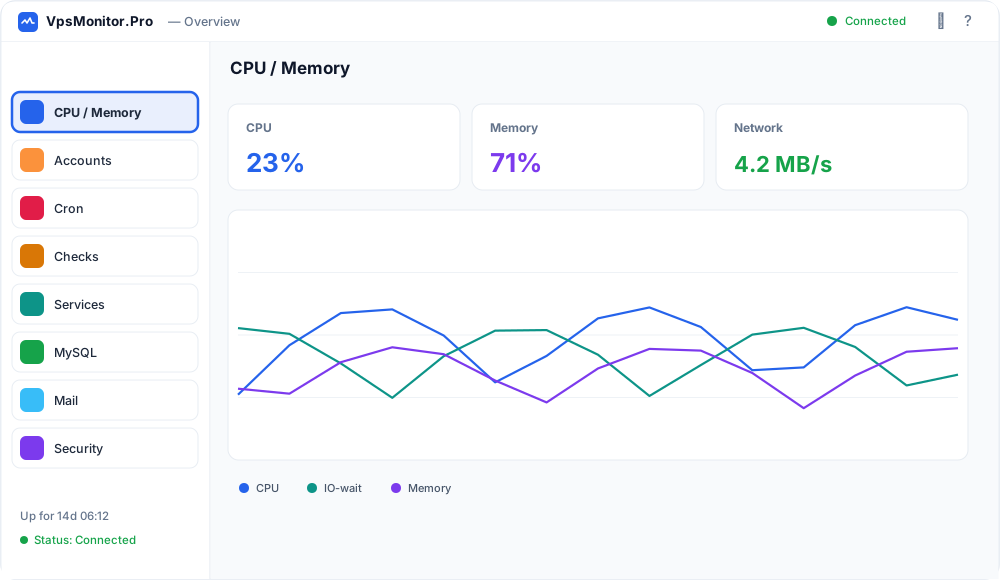
The app monitors one Linux server (VPS) over SSH. It connects on its own every few seconds, reads the state and shows it in charts and tables — so you don't have to log in over SSH and type commands by hand.
What it does
- Live metrics — CPU, memory (RAM), swap, network, load.
- Checks — dozens of automatic server-health checks (every 6 hours).
- Alerts — email and Telegram on critical problems.
- AI analysis — sends the collected data to an LLM for recommendations.
The left menu (sections)
Each coloured tile on the left opens a separate view: CPU/Memory, Accounts, Cron, Checks, MySQL, Mail, Security. At the bottom you see whether you are connected (green = the link works) and the app version.
Colours everywhere
The Help button
Every view has a Help button (or "?") that opens exactly this explanation. The Help menu at the top has the same information, split by section.
CPU / Memory — the "Performance" view
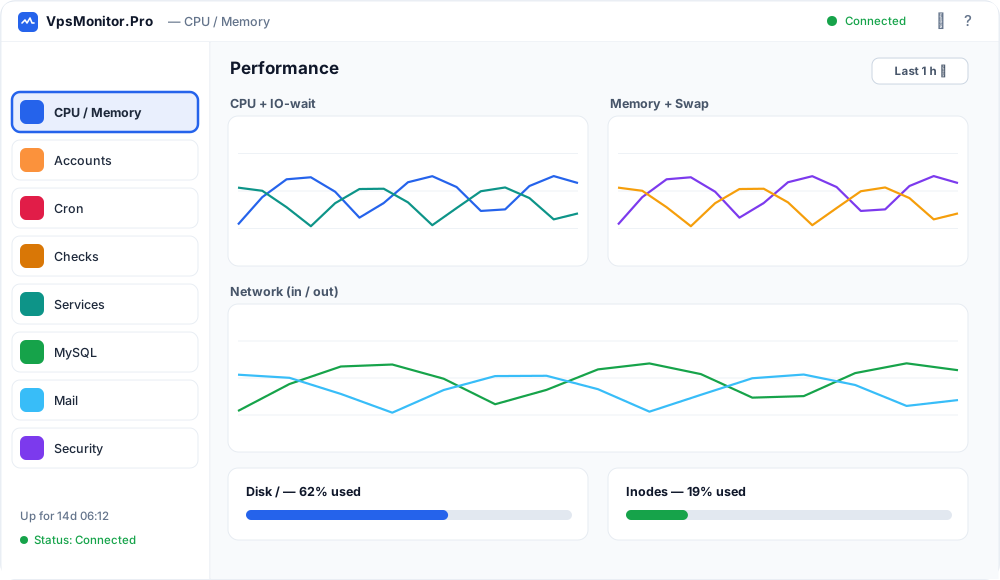
These are the live charts. Values refresh every few seconds (5 s by default). Top-right is a time-range dropdown (last minute, 30 min, hour, 6 hours, 24 hours, 7 days).
The charts
| Chart | What it shows |
|---|---|
| CPU + IO-wait | Percent of CPU in use. IO-wait (overlaid) = time the CPU spends waiting on the disk — high IO-wait means a slow disk / heavy read-write. |
| Memory + Swap | RAM in use and swap in use. Swap is "backup" memory on disk — used when RAM runs out, and it's slow. |
| Network (in/out) | Inbound and outbound traffic. The scale auto-adjusts (KB/s, MB/s). |
What's normal
- CPU: brief spikes to 100% are normal; constantly high = something is loading the server.
- RAM: 70–90% used is normal on a busy server. Linux deliberately uses free RAM as cache.
- Swap: a little used swap is fine; active swapping (constant in/out) = not enough RAM.
The "Processes" tab
Next to the charts is a Processes tab — a live process list (PID, user, %CPU, %MEM, command). It has a search box and buttons to kill a process or all of a user's processes (careful — killing is irreversible).
Bottom: status and Uptime
Bottom-left shows Up for … (how long the server has been running) and Status: Connected (green) when the link is active.
Availability — external uptime, latency & port scan
The Availability tab (inside the Performance view) runs external checks from your own PC — whether the server and your websites respond from outside, not just internally over SSH. It catches a problem an internal check can’t see: a site that is down from outside even though Apache is “up” (a DNS, firewall or routing issue).
Targets
Each row is one target, probed one of three ways:
- Ping (ICMP) — is the host alive.
- TCP port — does a service answer on a port (e.g. 443, or SSH).
- HTTP(S) — is the website serving (a status below 500 counts as OK).
It shows the status (up / down), the latency and how long a target has been down. On first open it auto-adds two checks for your server (a ping and the SSH port). The Import domains button pulls every hosted domain and adds HTTP checks for the ones you pick, so you can watch all your sites from outside. When a target goes down you get an email (once a day), a Telegram message and a desktop notification.
📡 Latency / route
Opens a window with a live latency chart — it pings the server every 1.5 seconds and shows current / minimum / average / maximum latency and packet loss — plus an on-demand traceroute that lists the whole network path, hop by hop, from your PC to the server. Useful for diagnosing a slow connection or a routing problem.
🔒 Port scan
Checks which ports are open on the server from outside. Risky ones — databases, caches and remote-admin services such as MySQL, Redis, PostgreSQL, VNC or RDP — are flagged in red, because they should not be reachable from the internet. Close them behind a firewall (CSF / iptables).
Accounts
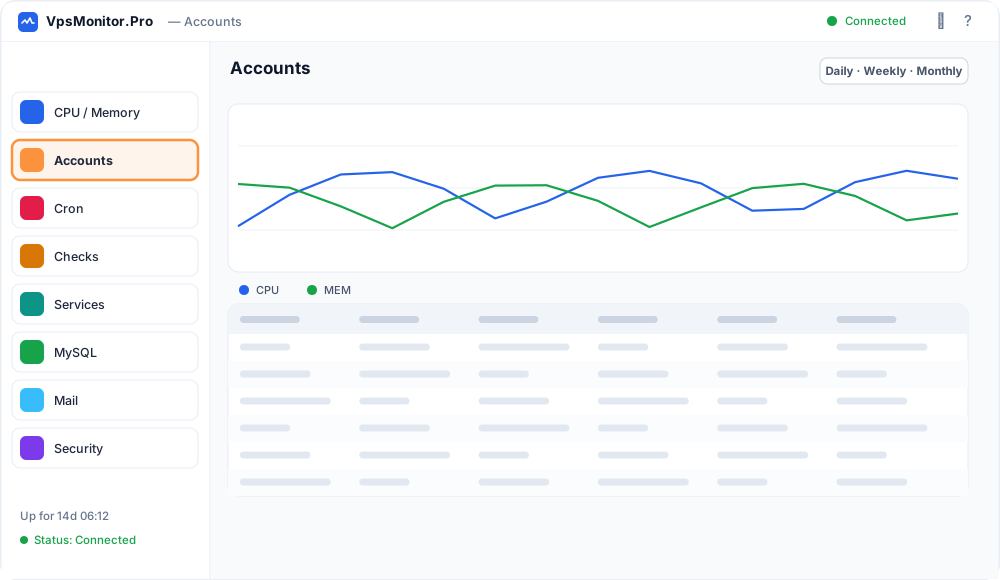
Shows how much CPU and memory each hosting account uses. The data comes from SPanel (/var/spanel/userstats/…), which records a snapshot every 5 minutes. The app aggregates it into Daily / Weekly / Monthly views.
The chart at the top
CPU and MEM lines by hour/day. Values are normalized — 100% = the whole server (all cores). So an account using 2 of 8 cores shows as ~25%, not 200%.
The table columns
| Column | Meaning |
|---|---|
| Account | The hosting account name (Linux user). |
| Primary domain | The account's main site. |
| CPU peak / avg | The highest and average CPU use for the period (% of the whole server). |
| MEM peak | The highest RAM use (% of total memory). |
| Cron | Number of scheduled tasks (cron) for the account. |
| Sent | How many emails the account sent in the period. The ⓘ button opens a breakdown by method / script / URL. |
The per-row buttons
- View stats (blue icon) — opens a per-process breakdown for the account, with the same chart filtered to just it.
- Check for problems (orange icon) — runs a DNS / SSL / traffic / ModSec check for the domain and can send it to the AI.
Why it's useful
When the server is slow, you instantly see which account is loading it — without digging through SSH.
Cron (scheduled tasks)
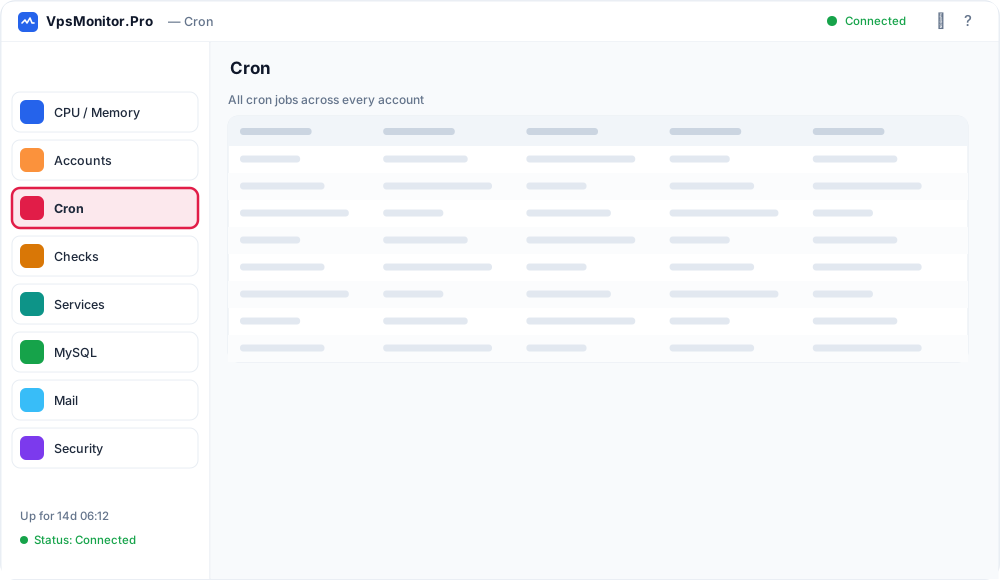
Cron is the Linux system for recurring tasks (e.g. "run this script every hour"). This view shows all cron jobs of all accounts on the server, read from /var/spool/cron/<user>.
The columns
| Column | Meaning |
|---|---|
| Account | Who owns the cron (account / Linux user). An account with a .suspended suffix is suspended. |
| Primary domain | The account's main domain. |
| Schedule | When it runs, in cron format: minute hour day month day-of-week. Example: 0 3 * * * = every day at 03:00. |
| Command | The command that runs. |
| Actions | A Delete button — removes this line from the crontab (with confirmation). |
Cron format in short
0 22 * * 0 means: minute 0, hour 22, every day of month (*), every month (*), day-of-week 0 (Sunday) → so every Sunday at 22:00.
Deleting
Delete is irreversible. The app does it safely via crontab -u, and for suspended (.suspended) accounts it edits the file directly. Handy for cleaning up crons left behind by deleted accounts.
Checks
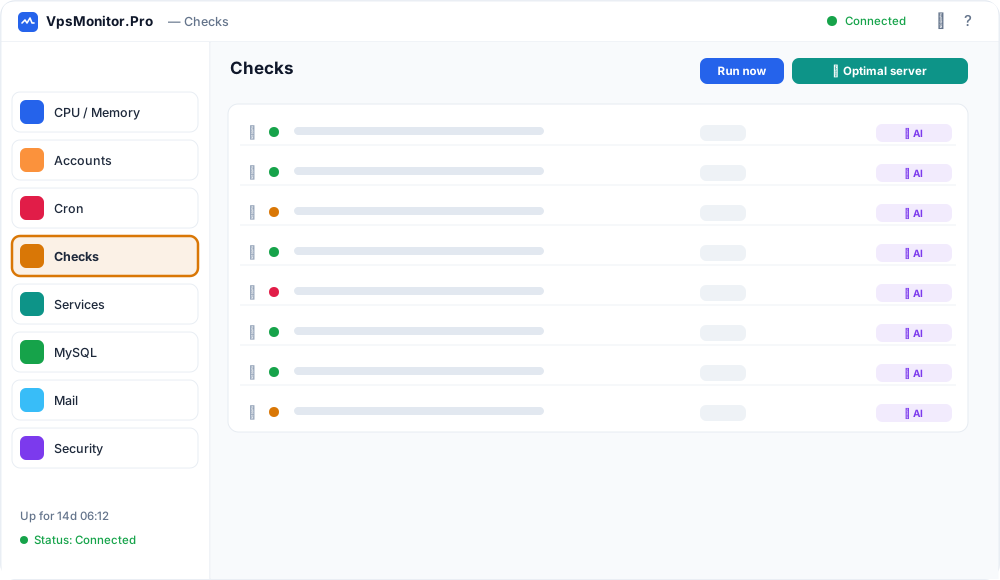
These are automatic server-health checks that run over SSH every 6 hours (or manually with the Run now button). Each check is a small script that runs on the server and returns a result.
The coloured dots
Click the arrow before a row to expand it and see the check's full output.
Where the other checks are
Checks are grouped by topic for convenience:
- MySQL checks → in the MySQL view
- mail checks → in the Mail view
- security checks → in the Security view
- services checks → in the Services view
- everything else → here, in Checks
Buttons
- Run now (top-left) — runs all checks immediately, without waiting the 6 hours.
- Optimal server (top-right) — a separate tuning tool (see the next section).
- Some checks have an action button (e.g. "Delete logs and errors"), and every check has a 🤖 Analyze with AI button for a plain-language verdict.
Optimal server
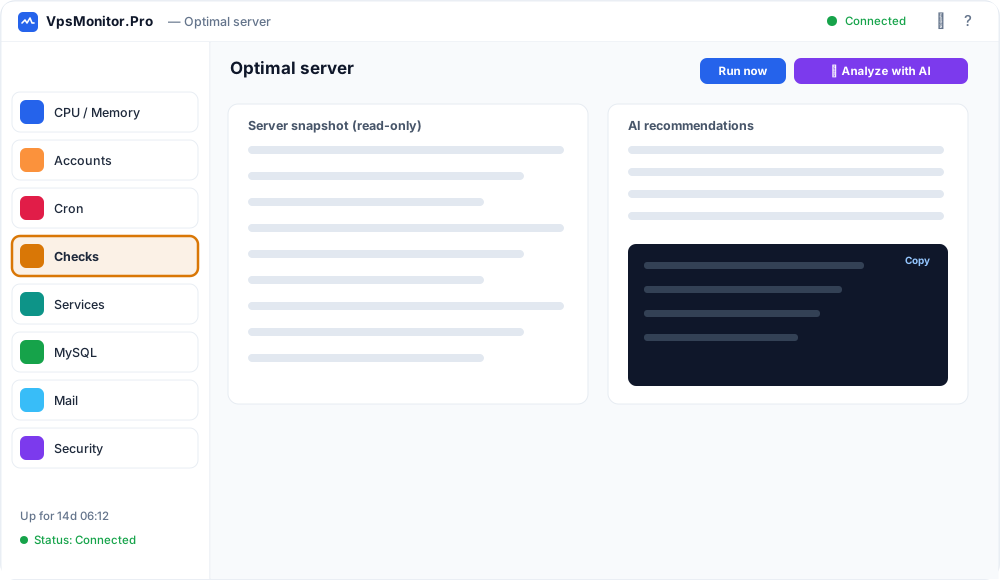
This tool collects a snapshot of the server and feeds it to an AI, which gives concrete tuning recommendations for exactly this hardware and account count. Nothing is changed automatically — you apply the recommendations manually over SSH.
How to use it
- Press Run now — the app collects the snapshot (up to ~90 s). It is read-only and completely safe.
- Press 🤖 Analyze with AI — the snapshot goes to the AI and you get a report shortly.
- You can ask follow-up questions in the chat.
What the snapshot collects
- Hardware — RAM, swap, CPU cores, load.
- Accounts — number of hosting accounts and databases.
- Current settings of Apache (MPM), PHP-FPM and MySQL/MariaDB.
- Security — firewall, SELinux, SSH login, MySQL networking.
- Plus the real results of the MySQL checks (slow queries, temp tables, etc.).
The AI report
For each area (Kernel/Swap, Apache, PHP-FPM, MySQL, Processes, Security) you get:
- an assessment of the current state,
- a table: parameter · current value · recommended · file · why,
- ready-made commands in a dark box with a Copy button,
- finally an Action plan by priority.
You need an AI key (Claude or ChatGPT) entered in Settings → AI analysis.
Services
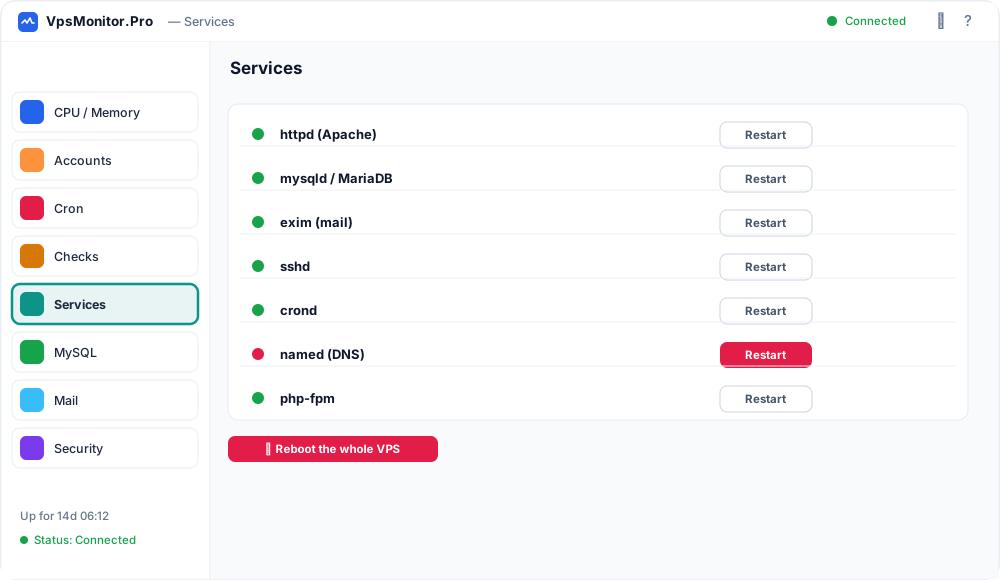
Shows whether the core services (daemons) on the server are running: Apache (httpd), MySQL/MariaDB, Exim (mail), SSH, cron, BIND (DNS), FTP, PHP-FPM, Redis.
The colours
Each tab is a separate service. Expand it to see details and when it was last checked. The Run now button checks immediately. Each row has a Restart button, and there is a 🔌 Reboot the whole VPS button at the bottom.
Fast down-detection
Besides the 6-hour check, the app runs a lightweight probe every 60 seconds (when enabled in Settings → Telegram) to catch a stopped service quickly and send an alert.
MySQL / MariaDB
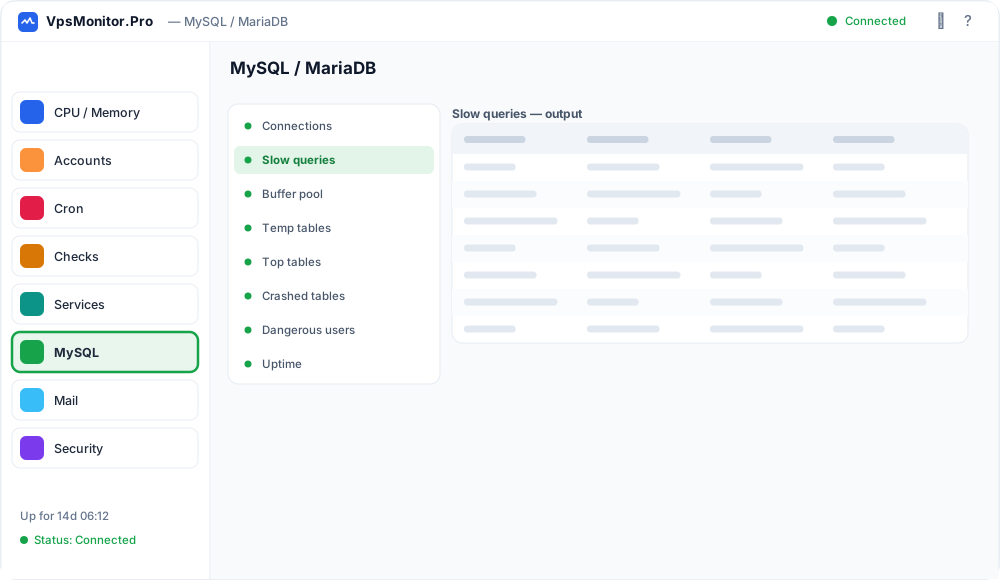
Checks for the database — performance, security and health. Each tab on the left is a separate check; expand it and press Run now to run it.
The key tabs
| Tab | What it's for |
|---|---|
| Connections and failed logins | Active connections and failed logins. Many failures = wrong credentials in a script, or an attack. |
| Slow queries | Slow queries — a top cause of a slow site. See which account generates them. |
| InnoDB buffer pool hit rate | Percent of queries served from memory (cache) instead of disk. Near 100% = good; low = innodb_buffer_pool_size too small. |
| Temp tables on disk | How many temporary tables spill to disk instead of RAM. Many = slow; raise tmp_table_size. |
| Top databases / tables by size | Which databases/tables are largest. |
| Crashed tables | Checks tables live (CHECK TABLE). Red = a corrupted table to repair. |
| Dangerous users | MySQL users with no password or overly broad privileges. |
| Uptime and version | Version and how long the database has been running. |
The colours
🟢 fine · 🟠 review · 🔴 problem. The result is shown in the right pane.
Some checks have an action button (e.g. tracing connections with auditd) — requires auditd on the server.
Mail — sent email
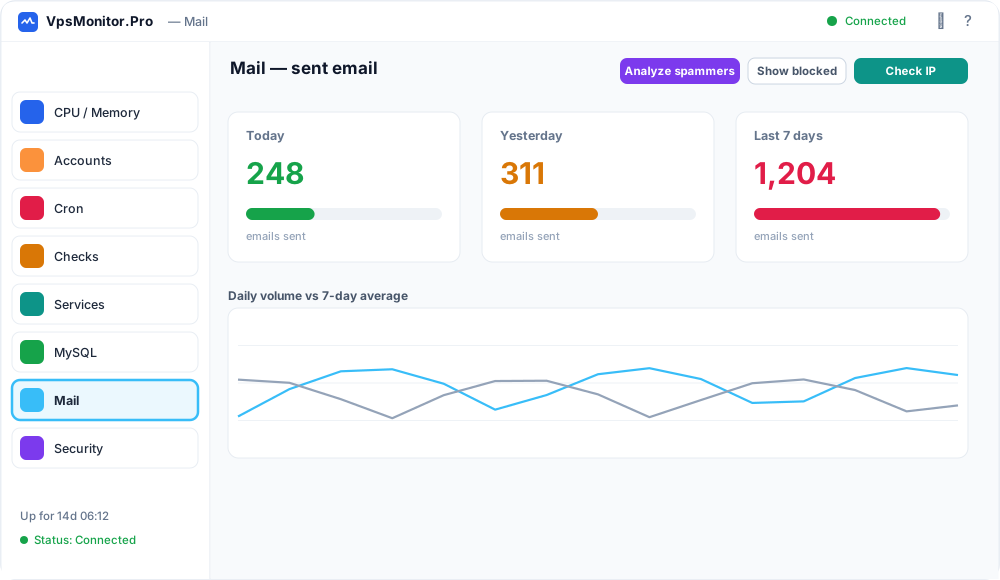
Shows how much email the server sends — today, yesterday, and versus the 7-day average. Useful for catching a hacked account or spam script that suddenly sends thousands of emails.
The tabs
Each tab is a period (Today, Yesterday, N days ago, Last 7 days) with the number of emails sent. The colour shows whether the volume is unusually high:
Anti-spam at the top
- Analyze spammers — scans Apache logs for POST requests (spam registrations / contact forms) and groups them by IP.
- Show blocked — IPs blocked for spam.
- History — a log of the actions.
- Check IP — type an IP and see whether it's blocked / whitelisted.
Security
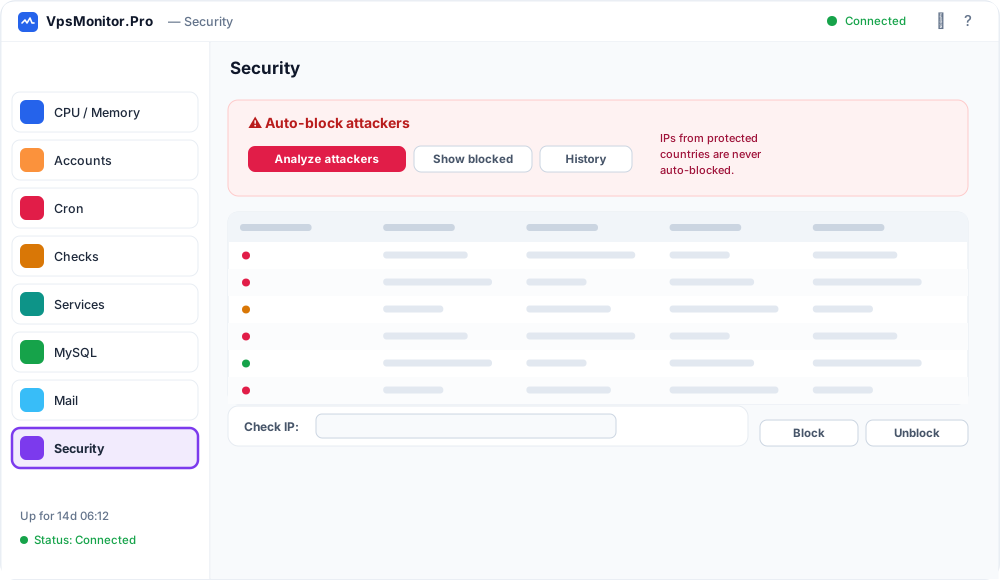
Security checks and a tool for auto-blocking attackers.
The red panel at the top: Auto-block
- Analyze attackers — scans the ModSecurity logs (
Access denied) for attacks (SQL injection, hacking attempts), groups them by IP, shows the country and attempt count, and offers one-click blocking via the CSF firewall. - Show blocked — a list of already-blocked IPs (with country and date).
- History — a full log of the blocks.
- It has anti-self-lockout: it skips your own IP and private networks.
Automatic scanning
You can enable periodic auto-blocking (every X minutes). IPs from protected countries are never auto-blocked — they're only shown for manual review.
Check / block an IP
At the bottom is a "Check IP" box — type an address to see whether it's blocked, whitelisted or in the history; plus buttons to manually Block / Unblock.
The other checks (tabs)
SSH brute force, firewall (fail2ban/CSF), RBL/blacklist of the IP, mail DNS (SPF/DMARC/PTR/MX), suspicious PHP files, and more. Colours: 🟢 fine · 🟠 review · 🔴 problem.
Settings
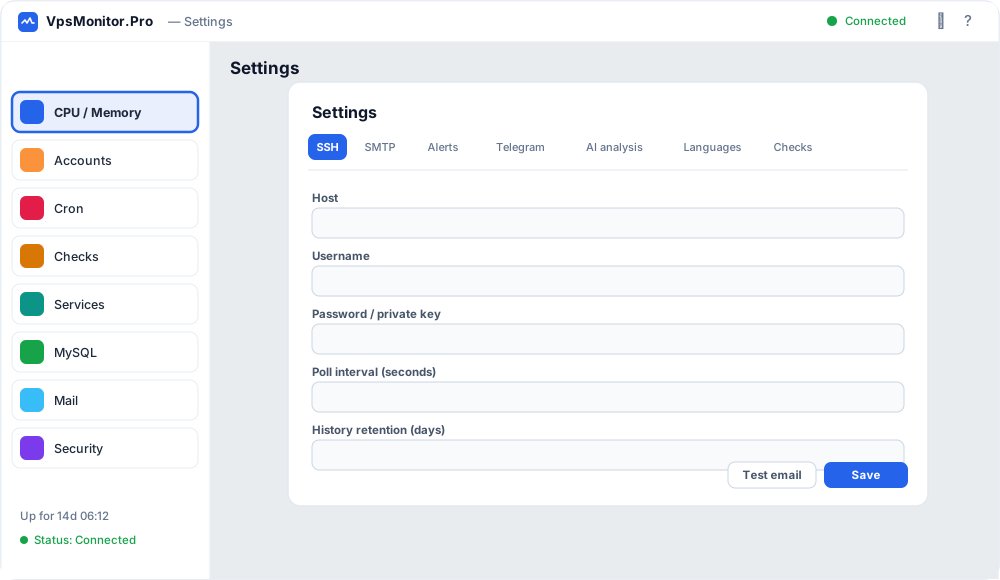
Opened with the ⚙ icon top-right. Saved to settings.json.
SSH tab
- Host / Port / Username — address and user to connect to the server. Default port 22.
- Password or private key (a key is recommended — more secure).
- Poll interval — how often to read metrics, in seconds (default 5).
- Retention — how many days to keep the data (default 7).
- VPS CPU cores — 0 = auto-detect; set an exact value only if auto-detect is wrong.
SMTP tab (email alerts)
Server, port, username, password, from/to address. A test email button.
Alerts tab
Thresholds for each rule (CPU, memory, swap, brute force, etc.). Each rule sends at most 1 email per day. A single Desktop notifications switch also pops a Windows tray notification for every alert type (services, security, mail, checks, availability) — even with no email or Telegram configured.
Telegram tab
Critical alerts only (high CPU/memory, a service down), throttled to 1 per 30 min. Needs a Bot token and Chat ID.
AI analysis tab
Choose a provider (Claude or ChatGPT), API keys and models. Only the chosen provider is used.
Languages tab
Choose the interface language. After switching, the app asks to restart.
Checks tab
Enable/disable individual checks.